How to debug wasted tool calls in LLM logs
Even when a failed tool call succeeds on a subsequent attempt, it still adds cost, latency and trace noise. This is my workflow for debugging wasted tool calls in LLM logs, separating necessary failures from avoidable ones and recording suggested prompt fixes. I'll also show you how to save the workflow as a skill.
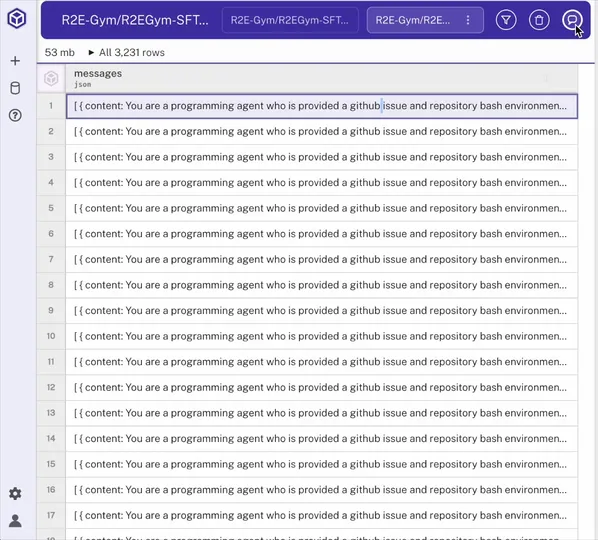
Step 1: Load the dataset into Hyperparam
I start by loading the file into Hyperparam. In this example, the file contains chat logs from an AI assistant designed to fix GitHub issues. Once it's loaded, I can review each conversation as a row and start working with the dataset in chat.
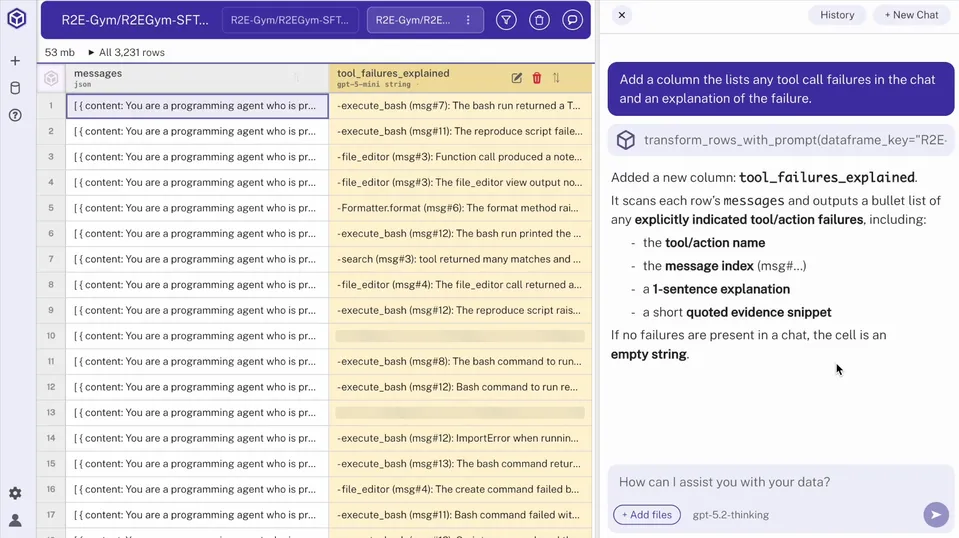
Step 2: Add a column for failed tool calls
In the chat, I ask Hyperparam to surface failed tool calls across the dataset and add them as a new column. Reading each chat one by one isn't feasible, so this derived column gives me a row-level view of which conversations contain tool-call failures.
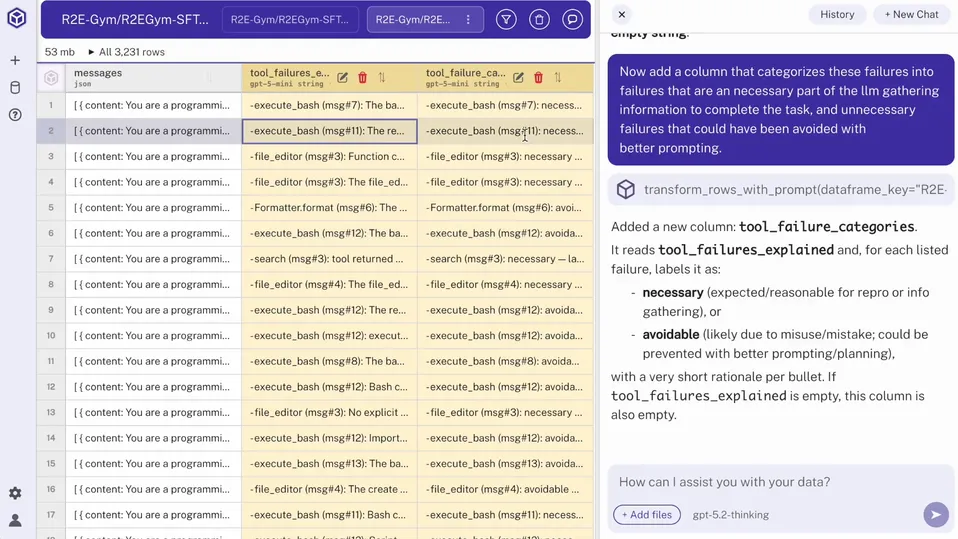
Step 3: Classify tool call failures as necessary or avoidable
Next, I classify each failed tool call as necessary or avoidable in a new column:
- Necessary failures: the call was necessary to determine whether something existed or a path was correct.
- Avoidable failures: the call failed due to wrong attribute names, shell syntax mistakes, unescaped pipe characters or other prompt-related errors.
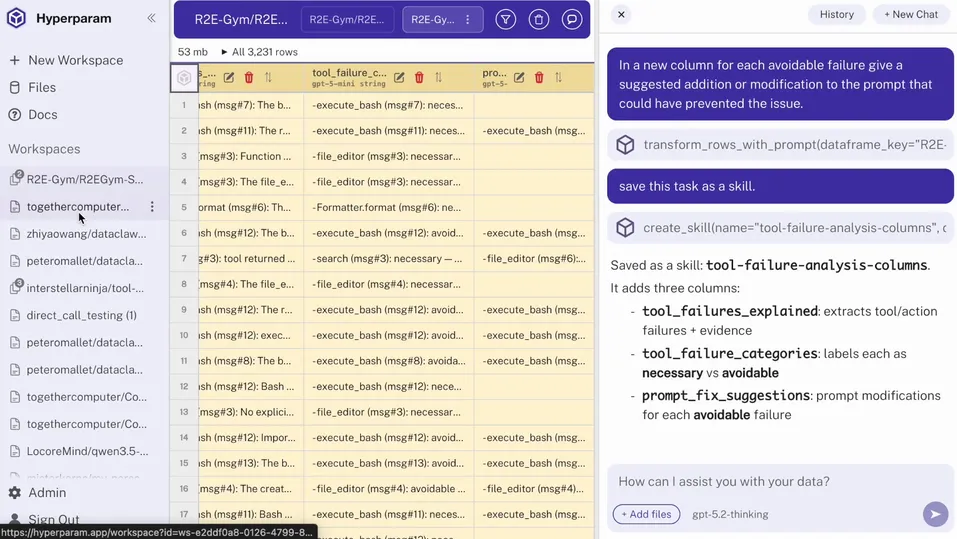
Step 4: Add a column with suggested prompt fixes
Then I ask Hyperparam to add a column with suggested prompt fixes for each avoidable failure.
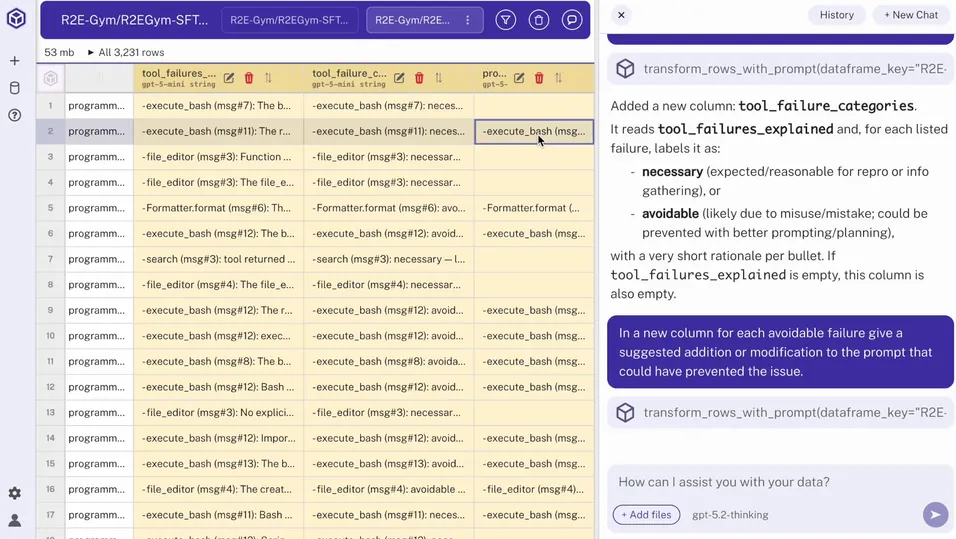
This suggests updates to the prompt that I can implement in my production environment.

Step 5: Capture the workflow as a reusable skill
Finally, I can save the workflow as a skill, which allows me to apply it to other datasets with similar tool-call issues, even if the underlying format is different. Now I can re-run this analysis every week to see how my model, tool and user behaviors change.